
A Retrospective on the 2018 General Election
In 2018, hundreds of candidates and organizations chose to work with Change Research because Change is fast, affordable, and accurate. We had a very successful 2018, conducting over 500 polls, working with winning candidates across the country at almost every level of government.
After the election, we spent many hours combing through our results to understand our accuracy. We found that Change Research’s Bias Correct methodology was more accurate than the (rightfully) widely praised NY Times/Siena polls in races where both organizations conducted polling, records high accuracy even in small state legislative districts, and overall is as accurate as or better than any other methodology: on average, Change Research estimated the Democratic candidate’s vote share within 2.6 points of what they actually received.
We have some great stories to tell:
- Change was the only pollster to show Andrew Gillum with a lead in the Florida Democratic primary
- Change showed Kendra Horn ahead in OK-05 when virtually no one thought she had a chance
- Change’s polling showed Steve King and J.D. Scholten in a surprisingly tight race in Iowa.
But as data scientists, we know how important it is to look at every poll result — not just a few standout numbers. The polling industry doesn’t have a history of transparency around accuracy, and we hope to change that. We’re serious about data, and we’re committed to continuous improvement as we build a technology that is as accurate as possible.
Polling Up and Down the Ballot
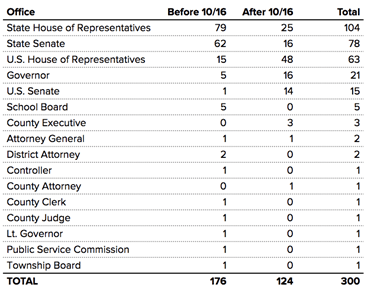
Change Research conducted over 500 polls in 2018, and 300 of them were tied to individual general-election races (the others spanned primaries in 2018 or were conducted for research unrelated to a specific election). We’re proud to have polled in hundreds of state legislative and local-office districts, spanning 16 different types of elected officials.
Measuring Change’s Accuracy
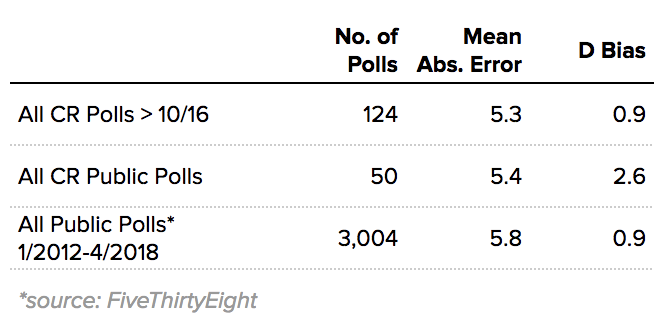
Change Research’s polling accuracy is best assessed on surveys we ran in the 3 weeks prior to Election Day, and where the surveyed electorate was less than 25% undecided (the latter removes from our analysis a handful of down-ballot, low-information elections with very large undecided groups even in the days before the election).
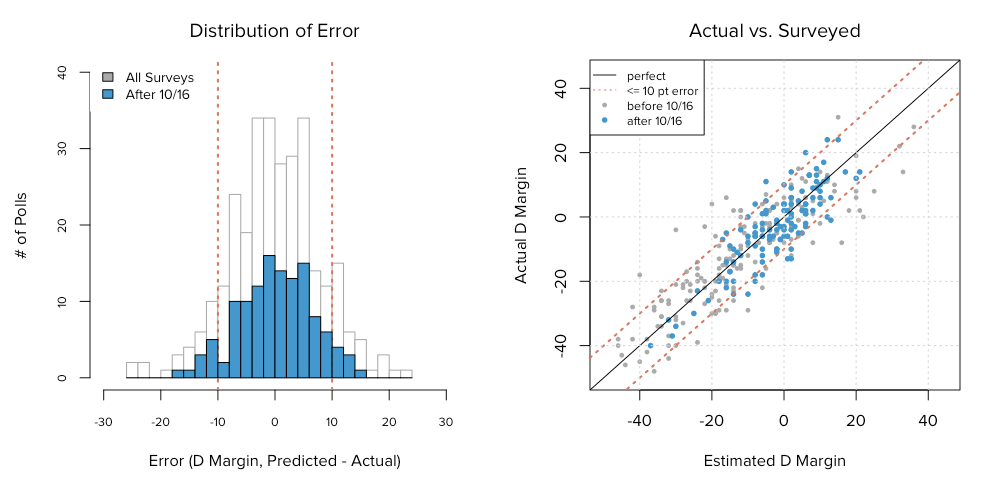
Using a traditional accuracy metric — the mean absolute difference between estimated and actual vote margin — we erred by 5.3 percentage points on average for polls conducted in the 3 weeks before Election Day. For example, a race pegged by Change Research as 55–45 in favor of the Democrat, where the actual outcome was 52–48, would be considered a 6-point error (D+10 vs D+4).
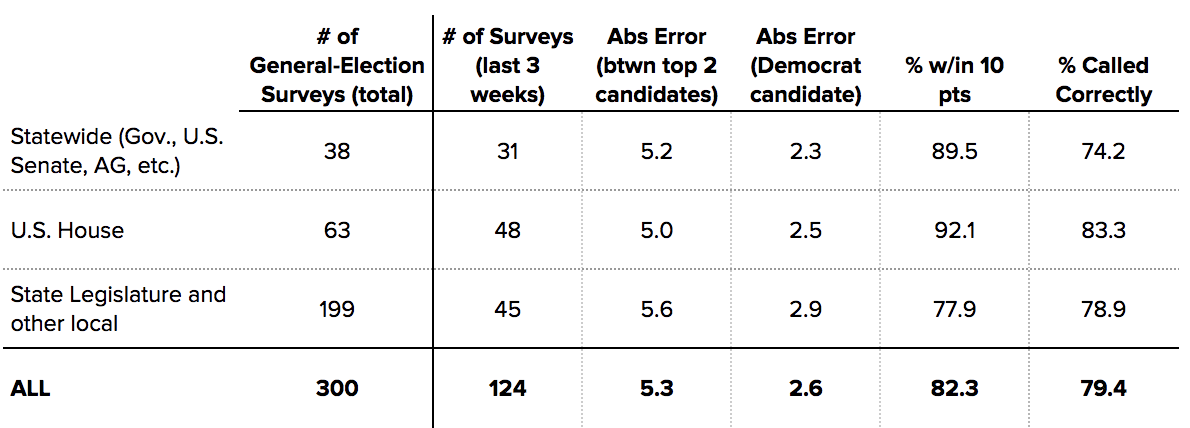
Put another way, our surveys estimated a vote share for the Democratic candidate that was 2.6 percentage points different from the actual outcome. More than 80% of our surveys were within 10 percentage points. Accuracy in down-ballot races was only about one point worse.
Comparison to Other Polls
Change Public Polls Only
Change Research publicly released 50 polls prior to the general election. Most of our polling is private and only made public when our clients choose to do so.
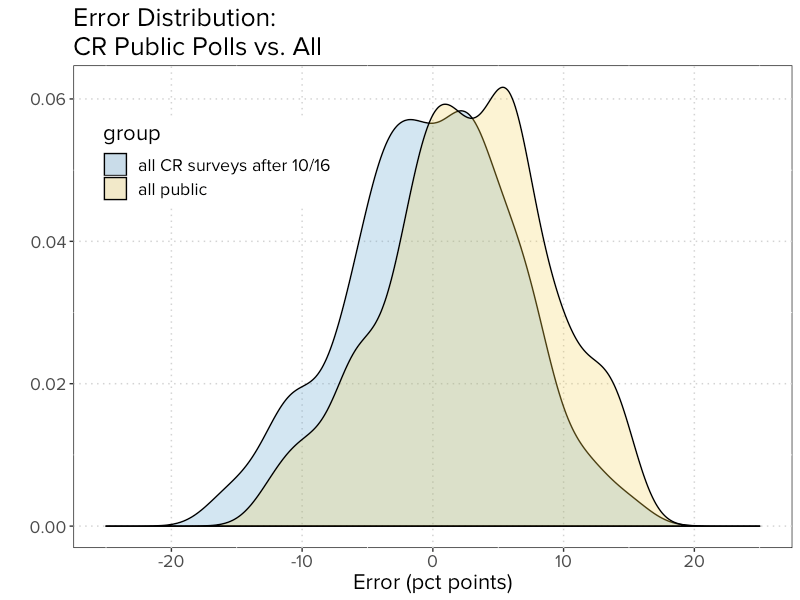
Both Our Public and Private Polls
When comparing our absolute error on the top-two margin among all our polls with available public comparisons, we are similar in terms of accuracy: slightly less accurate on Senate and Governor polls, and slightly more accurate on U.S. House polls. Of course, our average price per poll is only $4,000–5,000 — usually 80–90% less than what a candidate would pay for a traditional poll.
Comparison to Phone Polling
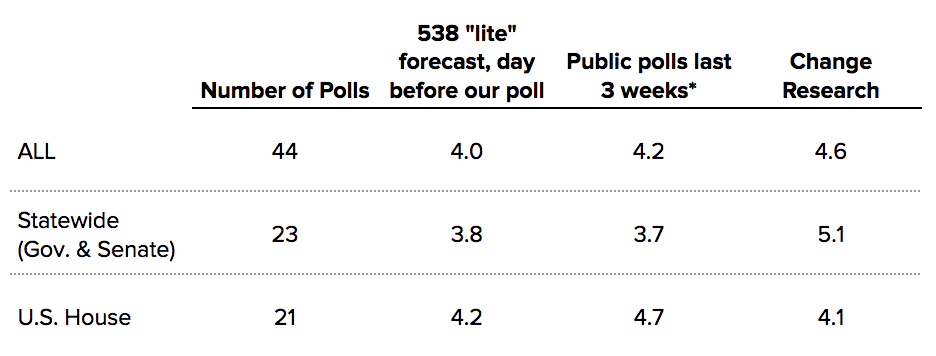
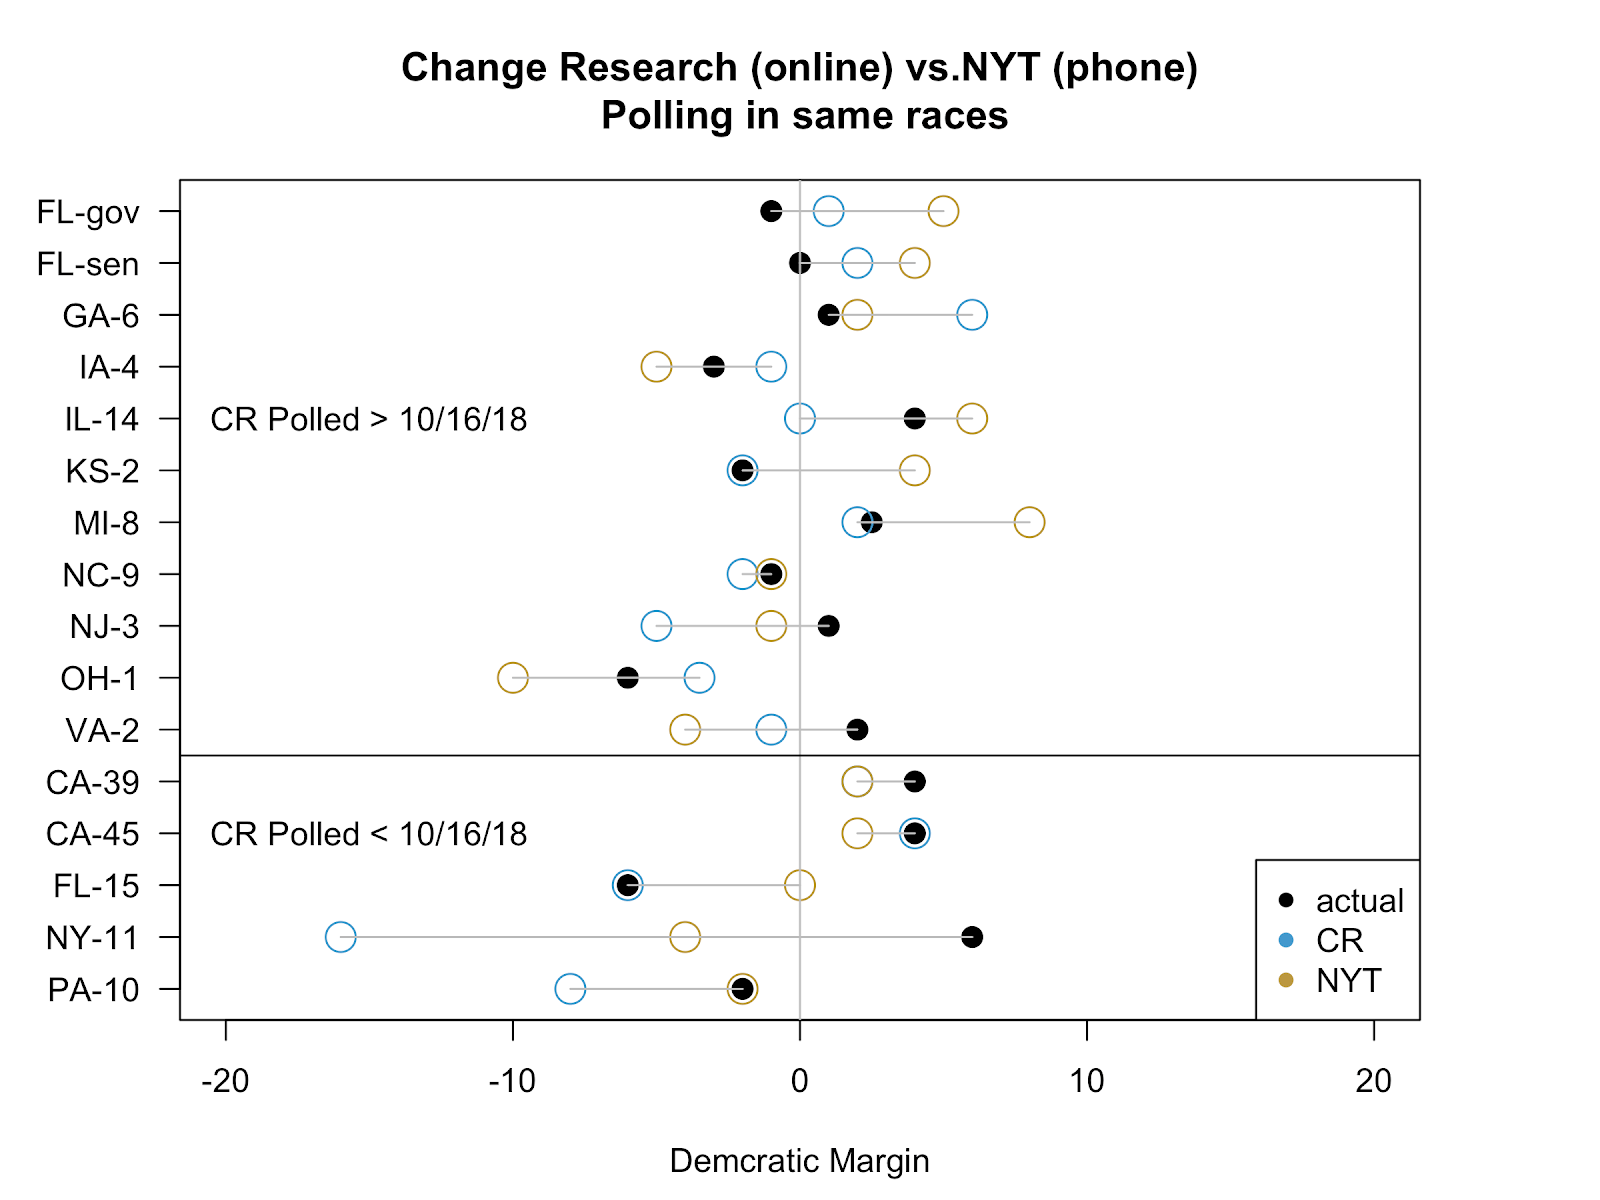
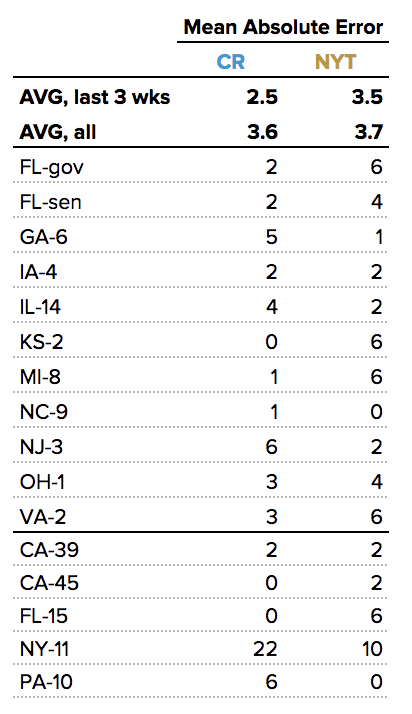
We were excited to see the NY Times conduct dozens of public polls this year to shed light on polling methodologies. As all of their polls were conducted by phone and with the voter file, they serve as a good proxy for this methodology. In total, there were 16 elections (US House, US Senate, and Governor) that were polled both by the NY Times and by Change Research, 11 of them in the 3 weeks prior to Election Day.
For these surveys, Change Research had a mean absolute error of 3.6 percentage points. In these races, Change Research was more accurate than the NY Times, which had a 3.7 point mean absolute error. Change Research was 1% more accurate (2.5% vs. 3.5%) on polls conducted in the last three weeks.
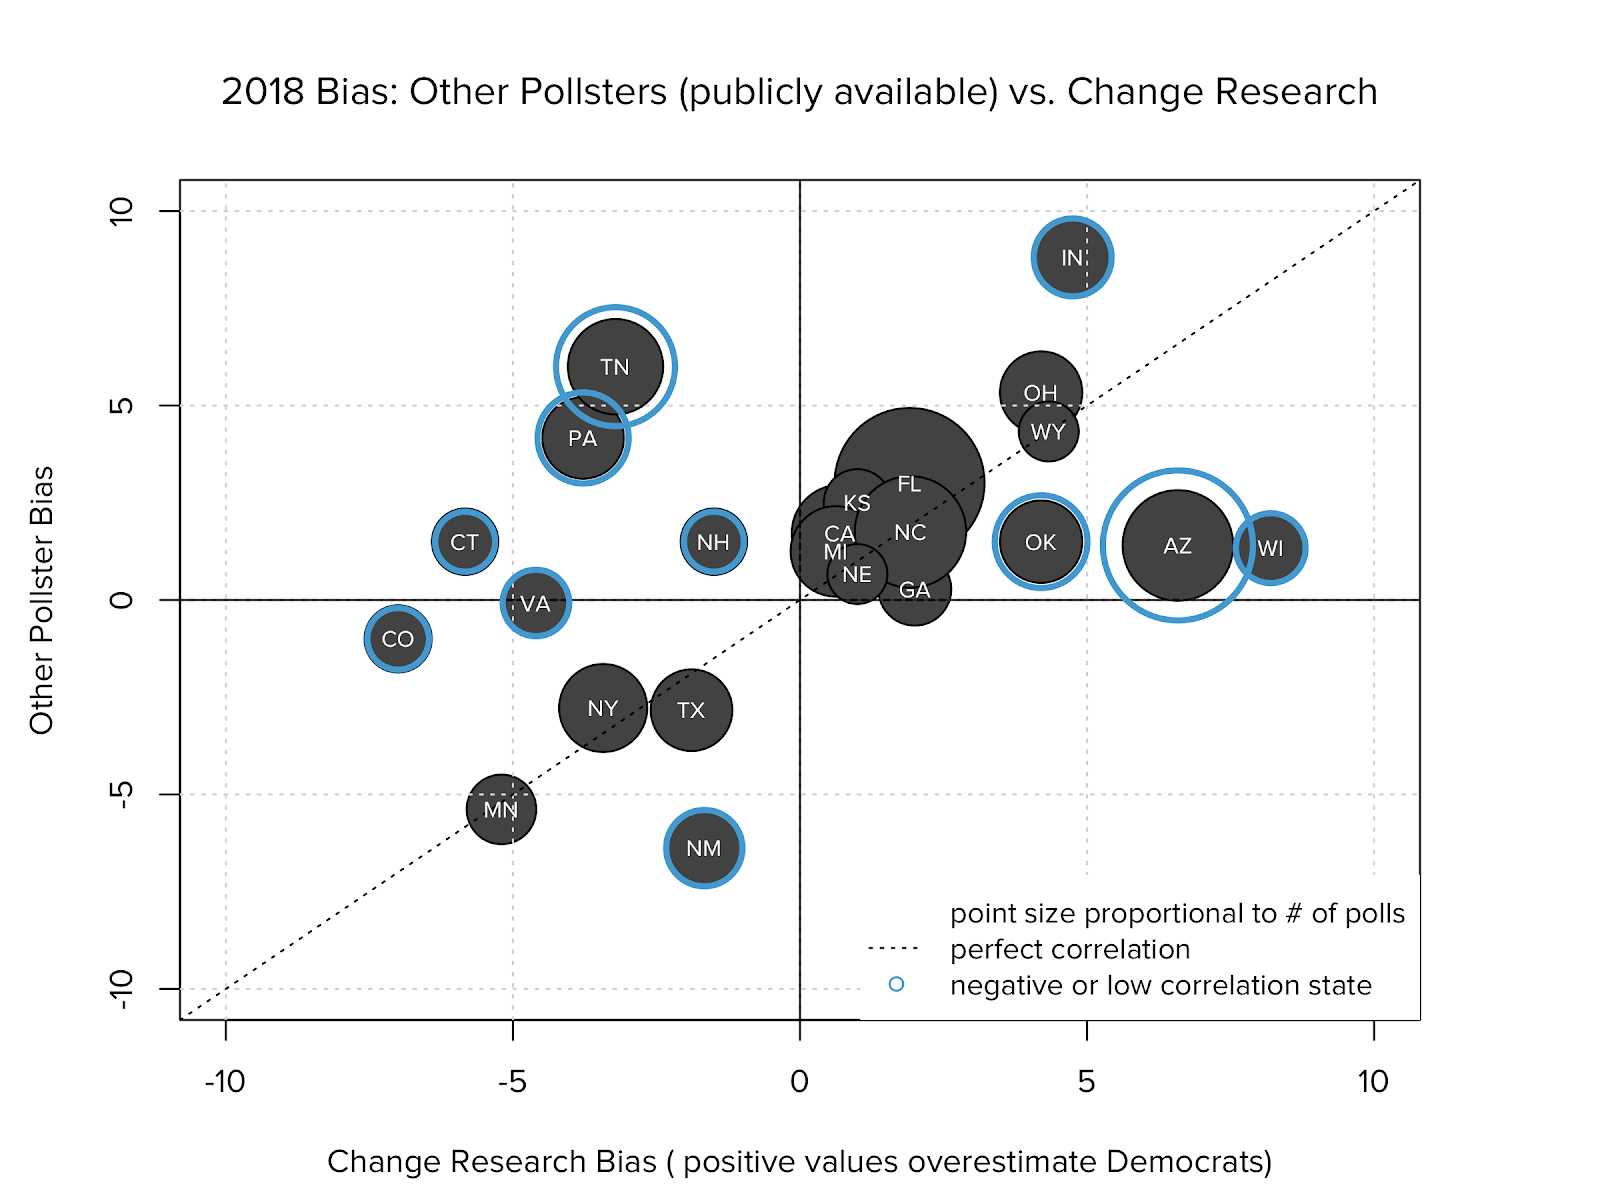
Uncorrelated Bias
Polling bias is the systematic over- or under-estimation of one party. Overall, Change Research had a slight Democratic polling bias in our polls: 0.9 percentage points. We’re well aware, though, that this average can hide bias that might exist within certain regions. For instance, our polls (and other public polls we found) overestimated Democrats in Ohio.
Headlines often read “How the polls got it right”, or “Where the polls were wrong”. These are premised on polling that has correlated errors: when one pollster misses, so do many. Some of this is a product of best practices in post-stratification weighting, which Change Research also adopts. But much of it is a product of reliance on the same survey methods.
For the most part, Change Research’s bias is uncorrelated to other pollsters. This means that Change Research’s unique survey methodology does not suffer from all of the same blind spots that traditional polling shares. This is not that surprising: we find respondents through online ads, while the vast majority of other pollsters do so via phones or panels. Importantly, our 2018 polls were opposite the public-poll conclusions in many states that are critical for Democrats, such as PA.
The Benefits of More Data
Building a technology platform to conduct inexpensive polling means we survey more respondents, in more geographies, and with more attention to the value of that collective data.
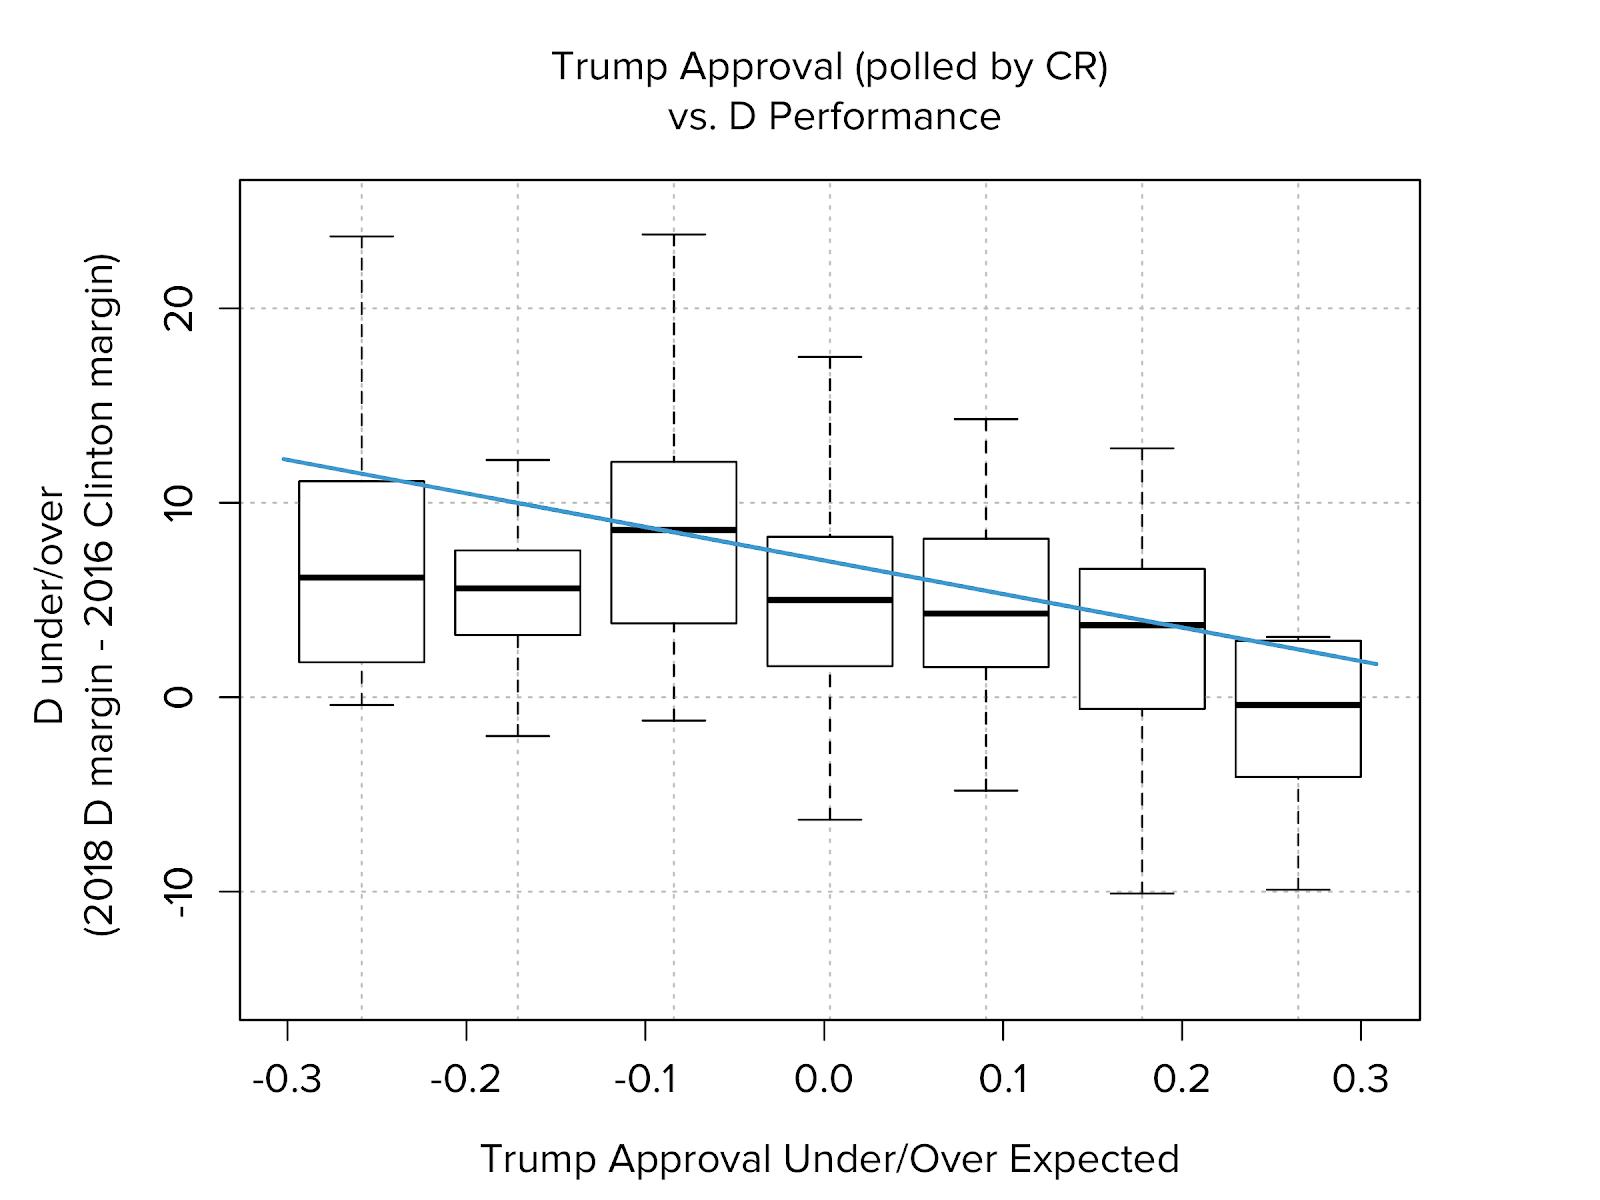
In the months prior to the election, we asked nearly all of our survey respondents how they would rate Trump on a 1–10 scale, and then mapped that rating to respondents’ Congressional Districts. Democrats running for the House beat their district’s 2016 Clinton margin by fewer points on average where Trump’s rating was better than expected. The opposite was also true where Trump’s rating was worse than expected. Lower than expected Trump ratings led us to poll in Oklahoma’s 5th District and Iowa’s 4th District, both traditionally Republican strongholds.
OK-05
- Our data showed Trump’s approval rating worse than expected
- District was thought to be solidly red
- Change proactively suggested polling for House Majority PAC
- Found Democrat Horn with a lead that was shocking to insiders
- Horn’s lead led to independent expenditures going into the race
- Ultimately helped Horn win 51–49
IA-04
- Similarly showed Trump’s approval rating worse than expected
- Fielded a poll in the district in just 1 day
- Our public poll showed JD Scholten 1 point behind incumbent Steve King
- $900,000 poured into Scholten’s campaign in 48 hours
- King was dropped by NRCC + other sponsors
- Scholten came within 3 points
Small-District Capabilities
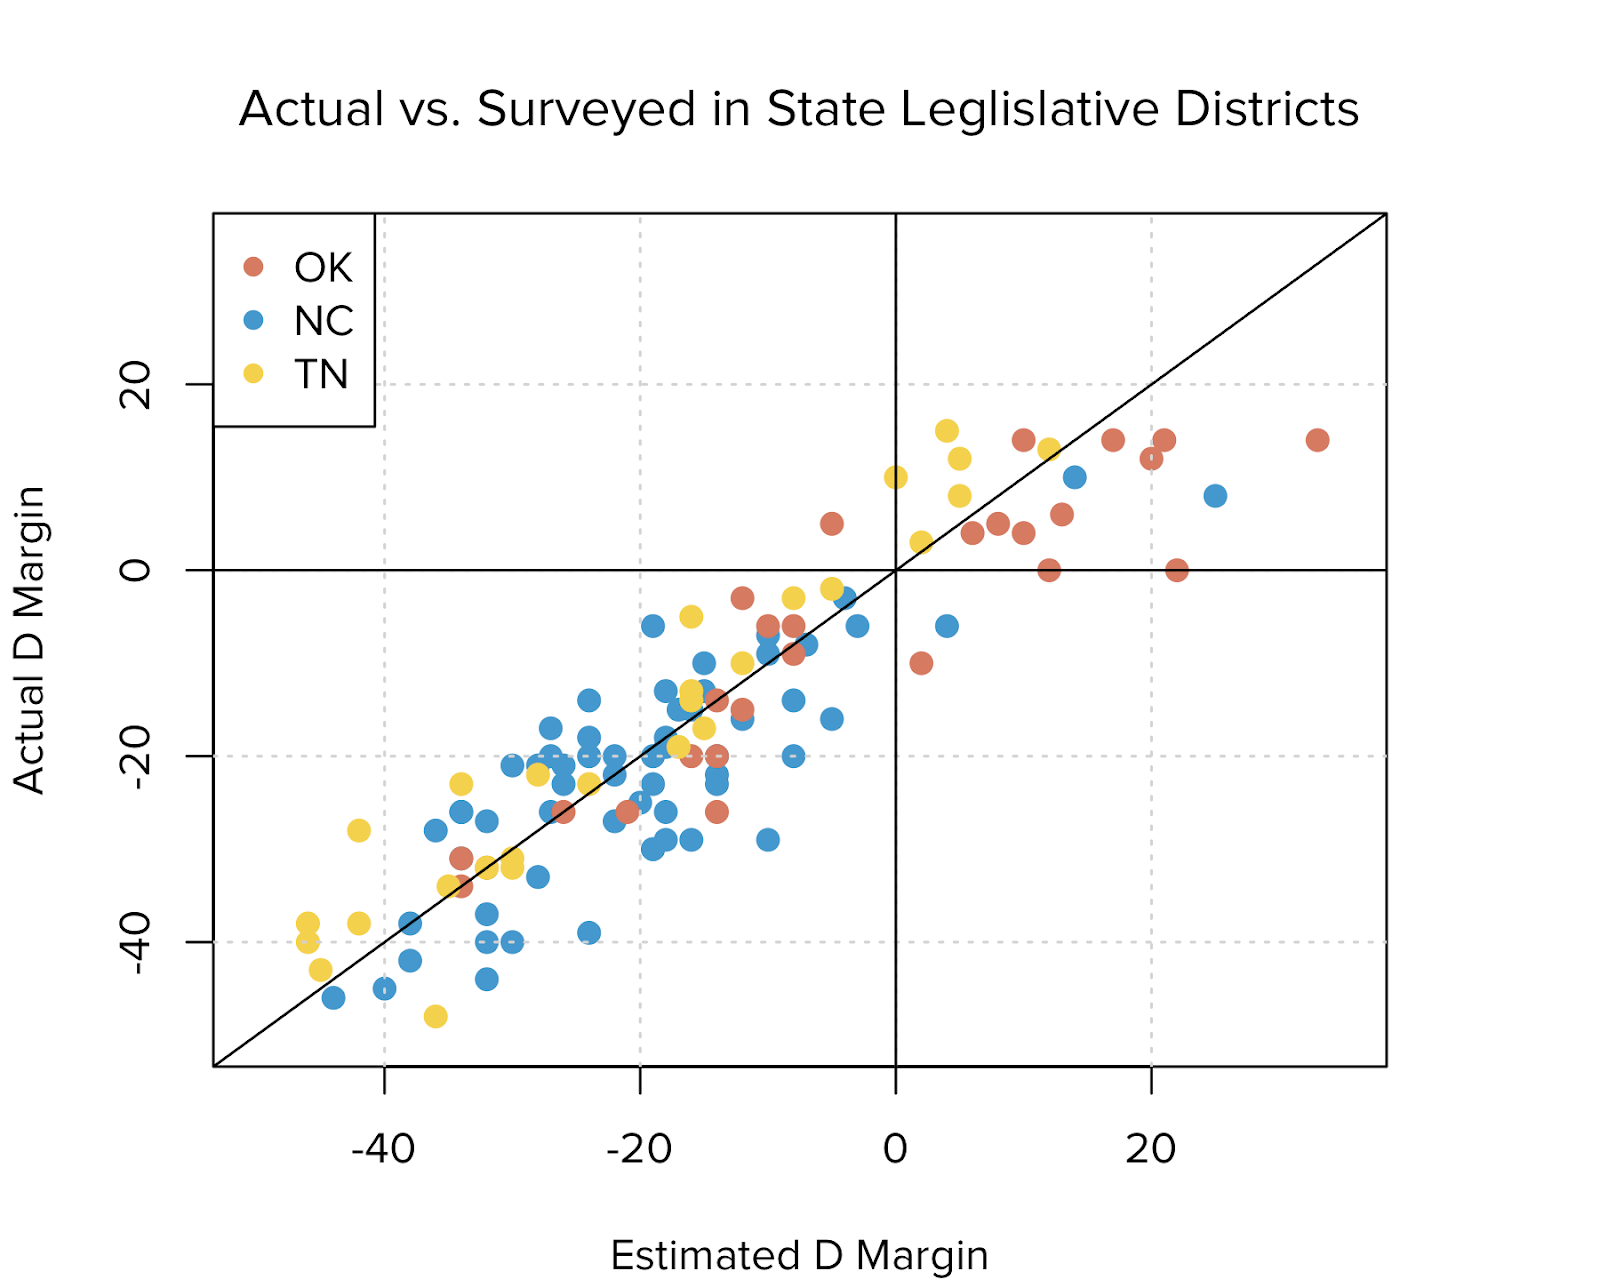
Change Research conducted 182 general-election polls in state legislative districts. Much of this polling came in the South, where we delivered large-scale polling to parties and committees in Florida (14 polls), North Carolina (60 polls), Oklahoma (27 polls), Tennessee (28 polls), and Arizona (11 polls).
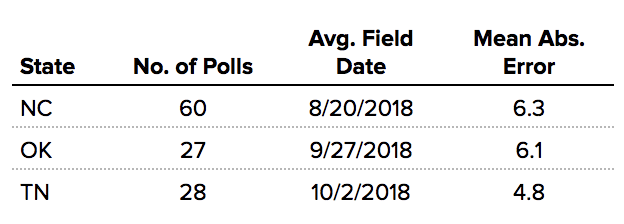
Our mean error for these polls (~6 percentage points) was fairly close to our overall average. We attribute the wider error mostly to the timing of these surveys, which came in the late summer and early autumn and is outside the usual “3 weeks prior” standard that we’d use to assess our accuracy.
The voting population of legislative districts in these three states ranges from about 37,000 (OK, State House) to about 192,000 (TN, State Senate). Change Research was able to sample 300–600 voters in these districts, extrapolate accurately, and at a cost that makes large-scale polling feasible even for down-ballot races.
Constant Improvement
We sought to help as many candidates as possible in 2018, through unmatched affordability and speed without having to sacrifice on accuracy. While doing so, we surveyed nearly 1.1 million respondents and polled in hundreds of elections. We’ll be using this data in 2019 as our laboratory to improve polling accuracy no matter what office our candidates seek.
Appendix 1: Our Methodology
ApproachChange Research collects survey responses by publishing targeted online solicitations via advertisements on websites and social media platforms. By soliciting a representative set of web and social media users to take a poll, Change Research is able to cast a net that is wider than landlines. We reach men and women; twenty-somethings and seniors; rural and urban; and members of every race, creed, and political persuasion.
Targeting the right respondentsChange Research uses a combination of proprietary geo-targeting technology and voter file data to invite respondents in a specific district, be it a district for city council or U.S. Congress.
Dynamically adjustingAs we’re collecting survey responses, our Bias Correct technology adjusts our targeting to get a sample that reflects the electorate or population. We establish — and can rapidly adjust — advertising targets across age, gender, race, and partisanship to reflect a district’s demographics. Any imbalances in the survey sample can be quickly detected and corrected while the survey is still fielding, rather than relying solely on post-survey techniques for big corrections.
Extrapolating to the populationOnce all the responses are in, our technology takes over, quickly and accurately performing an automated post-stratification weighting to ensure that all segments of the electorate are properly represented in the poll. We also utilize models based on data we collect throughout the year to estimate turnout, not solely relying on the patterns of a prior election.